1. Home Run
How to hit Home Runs
|
|
|
|
home_run
|
|
|
|
Launch Angle
|
0.098*
|
|
|
(0.058)
|
|
|
|
|
Exit Velo
|
0.676***
|
|
|
(0.168)
|
|
|
|
|
Sweet Spot%
|
-0.062
|
|
|
(0.068)
|
|
|
|
|
Barrel Batted%
|
1.198***
|
|
|
(0.105)
|
|
|
|
|
Constant
|
-56.895***
|
|
|
(14.126)
|
|
|
|
|
Observations
|
556
|
|
R2
|
0.476
|
|
Adjusted R2
|
0.472
|
|
Residual Std. Error
|
7.423 (df = 551)
|
|
F Statistic
|
125.007*** (df = 4; 551)
|
|
|
|
Notes:
|
***Significant at the 1 percent level.
|
|
|
**Significant at the 5 percent level.
|
|
|
*Significant at the 10 percent level.
|
2. Strikeout
Strikeouts
|
|
|
|
strikeout
|
|
|
|
Out of Zone Swing%
|
1.086***
|
|
|
(0.126)
|
|
|
|
|
In Zone Swing and Miss%
|
2.435***
|
|
|
(0.136)
|
|
|
|
|
Called Strikes
|
0.313***
|
|
|
(0.007)
|
|
|
|
|
Launch Angle Average
|
0.619***
|
|
|
(0.136)
|
|
|
|
|
Constant
|
-75.517***
|
|
|
(5.669)
|
|
|
|
|
Observations
|
556
|
|
R2
|
0.789
|
|
Adjusted R2
|
0.788
|
|
Residual Std. Error
|
19.583 (df = 551)
|
|
F Statistic
|
516.568*** (df = 4; 551)
|
|
|
|
Notes:
|
***Significant at the 1 percent level.
|
|
|
**Significant at the 5 percent level.
|
|
|
*Significant at the 10 percent level.
|
3. Density Graph
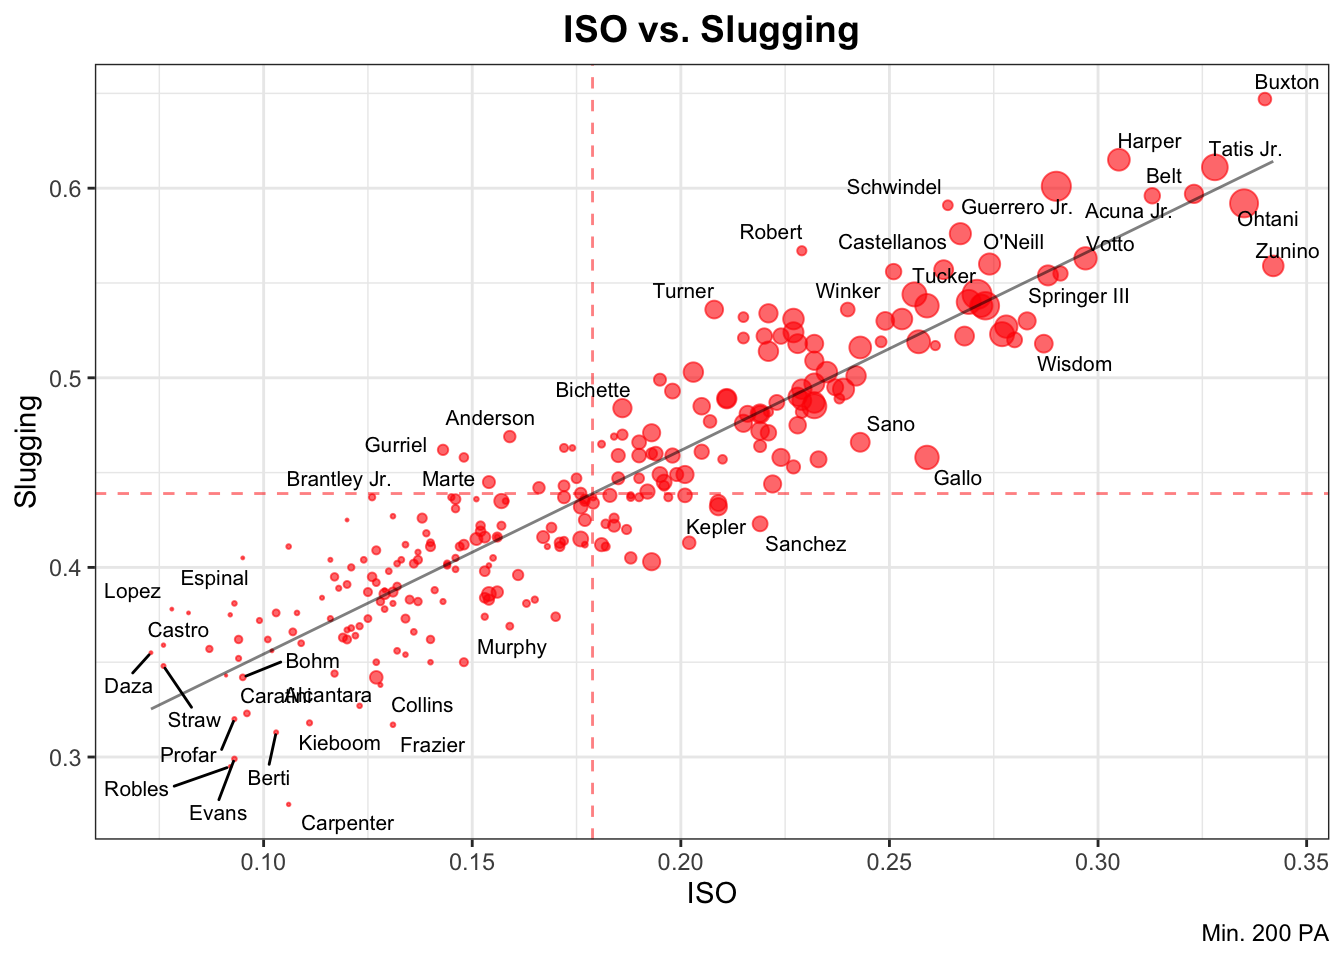
Slow players like Mike Zunino have some of the highest ISO’s in the league, but his slugging falls behind. How much does speed have to do with getting extra bases?
Slugging
|
|
|
|
slg_percent
|
|
|
|
Sprint Speed
|
0.007***
|
|
|
(0.001)
|
|
|
|
|
ISO
|
1.323***
|
|
|
(0.028)
|
|
|
|
|
Constant
|
0.001
|
|
|
(0.030)
|
|
|
|
|
Observations
|
554
|
|
R2
|
0.823
|
|
Adjusted R2
|
0.823
|
|
Residual Std. Error
|
0.042 (df = 551)
|
|
F Statistic
|
1,282.477*** (df = 2; 551)
|
|
|
|
Notes:
|
***Significant at the 1 percent level.
|
|
|
**Significant at the 5 percent level.
|
|
|
*Significant at the 10 percent level.
|