Drew Weber
————————————————–
1. WR Separation Data
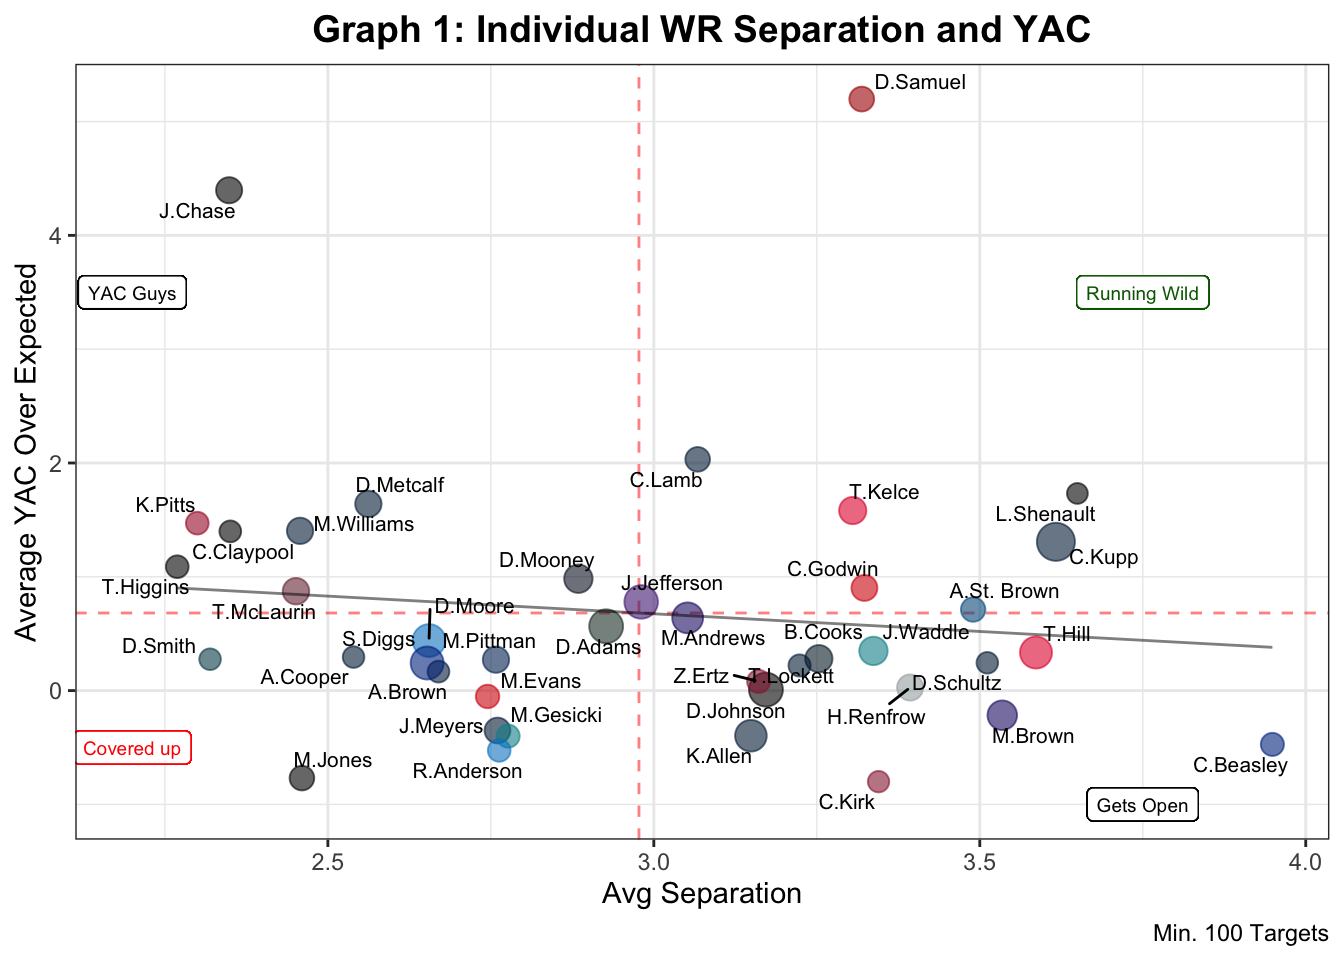
This graphic shows Average Separation and Average Yards After Catch Over Expected. These are two important metrics on receiver performance. Separation may be the most important thing a WR can generate in football. Combining that with how well they do with the ball in their hands can paint a decent picture of how they are performing. It can be seen that Deebo Samuel is in a world of his own this year. His separation may be somewhat accredited to Shanahan route designs, but it cannot be understated how well he was as a playmaker this season.
2. Team Receiver Data
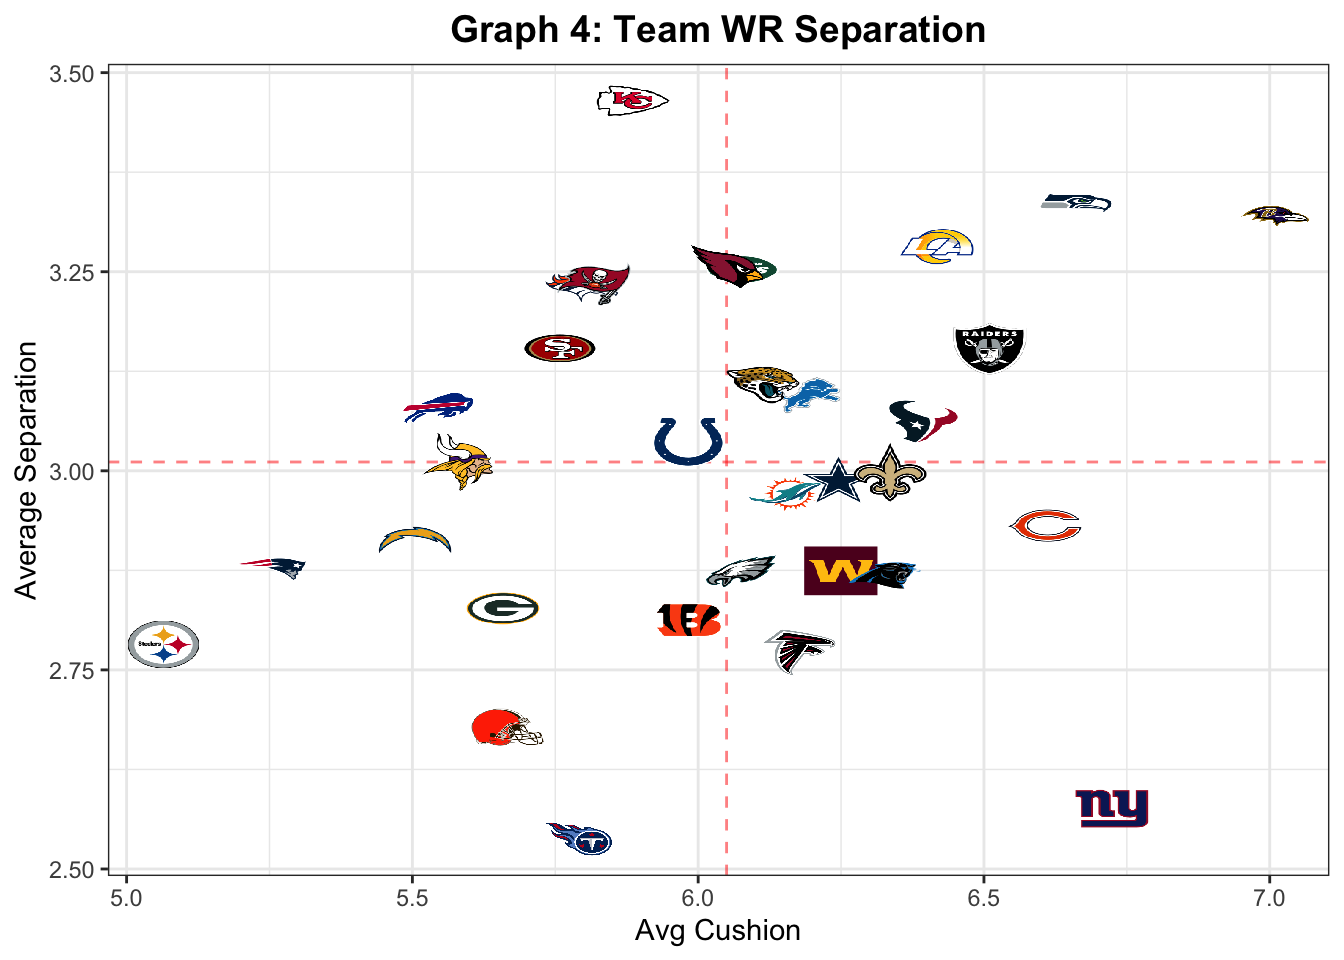
This graphic shows Team Separation and Cushion data. This is important because it can show how teams are being played defensively and how they perform against that.
3. aDot
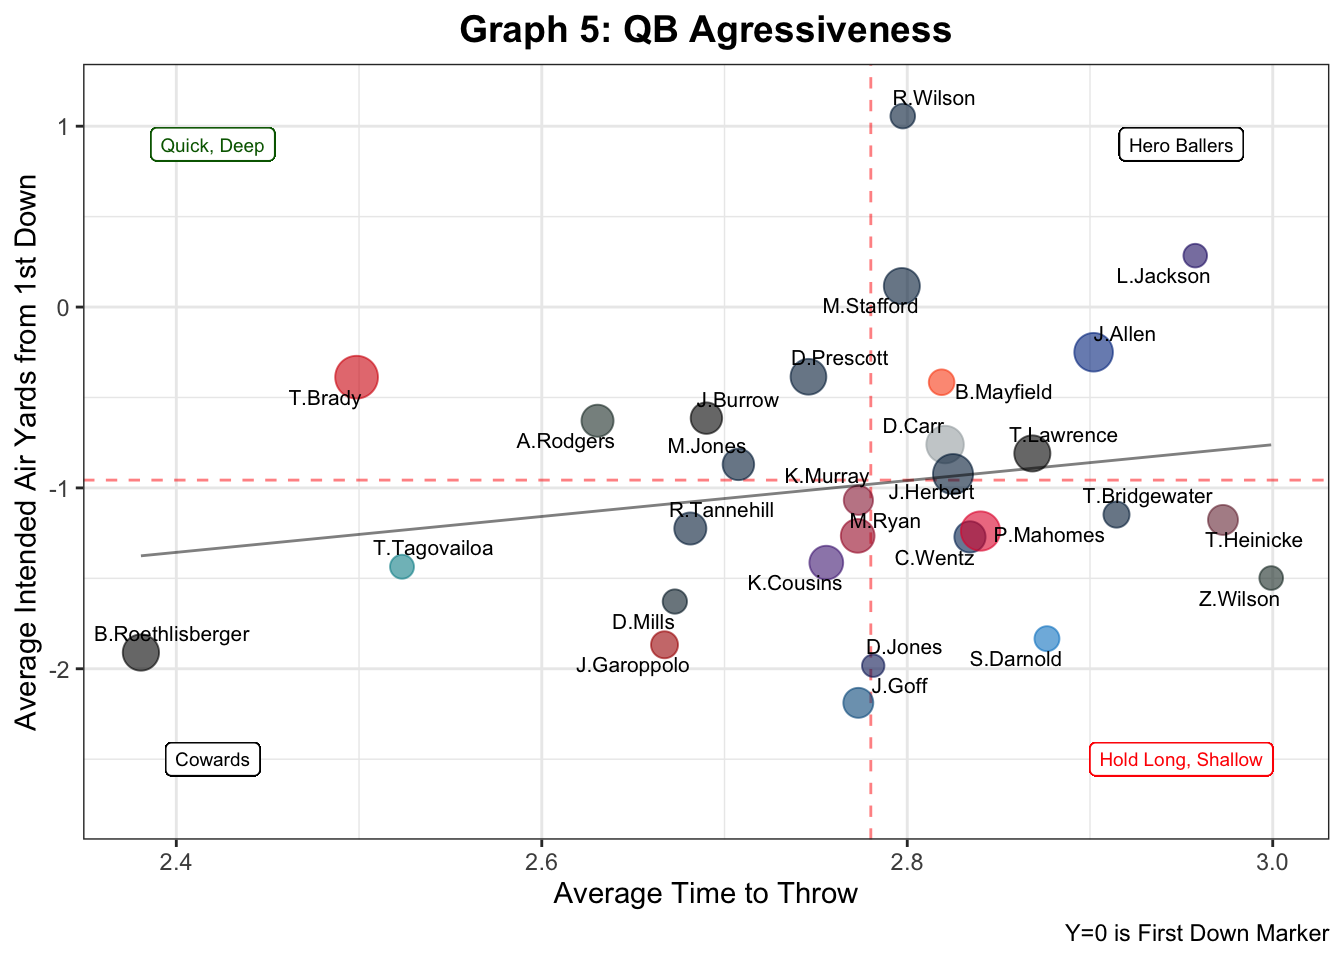
This graphic shows the Average Time to Throw to the Average Intended Air Yards From the Sticks. This means that Y=0 is the first down. This is meant to show how QBs are getting the ball out. The upper left is the best place to be. It means these passers are getting the ball out quickly AND farther than average. Conversely, the bottom right is a bad place to be. It means these passers hang on to the ball long AND throw it shorter than average.
4. QB Sack Data
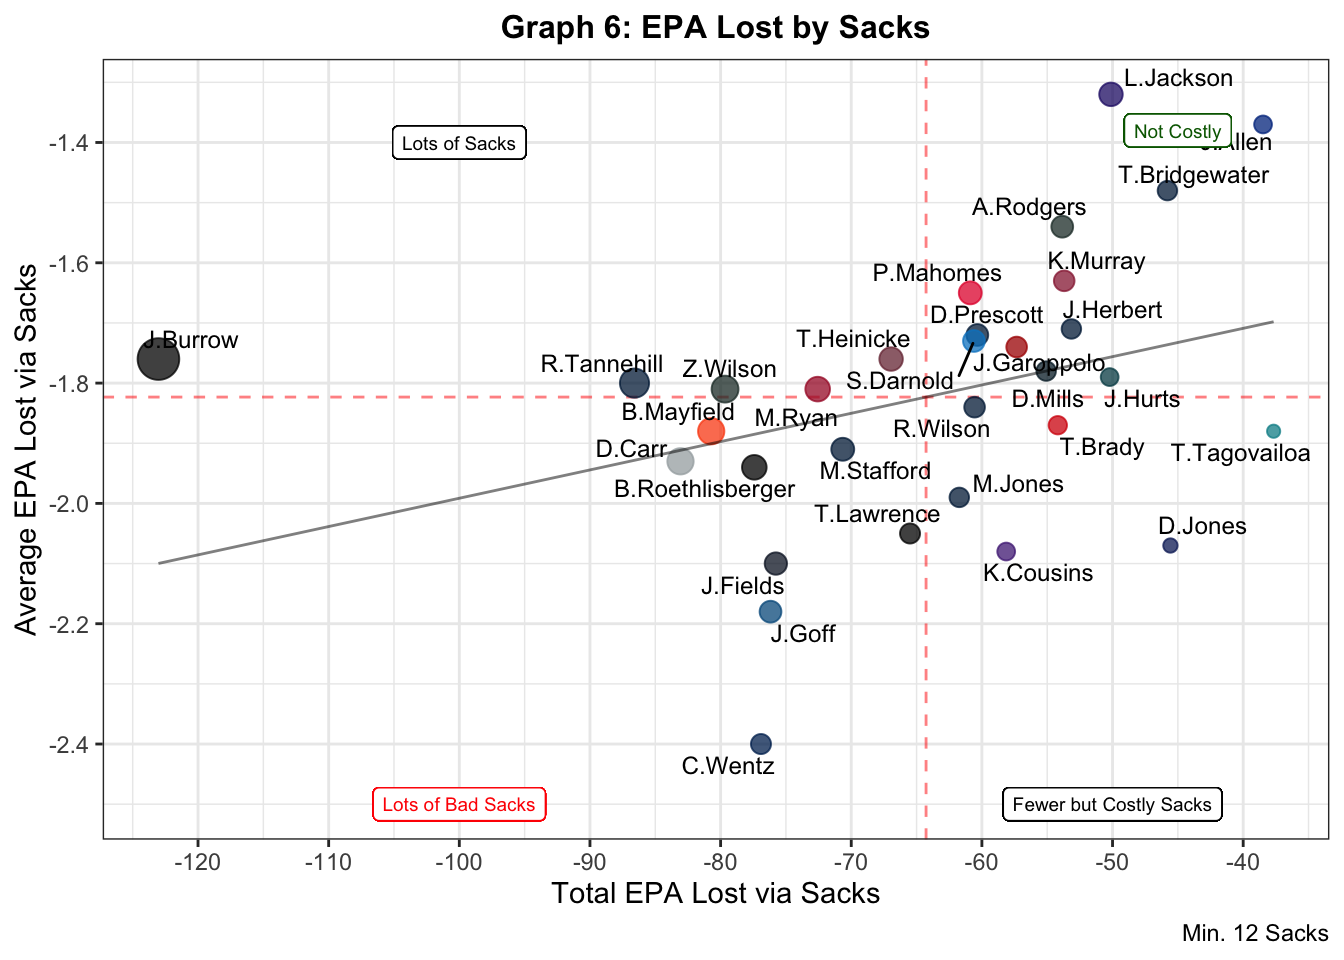
Not all sacks are created equal. A sack on 1st and 10 is most likely much worse than a sack on 3rd and 20. It can ruin a drive or can be almost the same as an incompletion. This graphic shows how much EPA is being lost on average and in total. The outliers are what should be noted most from this graphic. Wentz is a catastrophe, whereas Burrow lost the most EPA but wasn’t killing the Bengals every time he did it. Lamar Jackson and Josh Allen are freaks and it is interesting to see if the sack “avoiders” remain this way year over year.`
| name | av_epa_lost | total_epa_lost | team | Sacks | |
| 1 | L.Jackson | -1.32 | -50.12 | BAL | 38 |
| 2 | J.Allen | -1.37 | -38.48 | BUF | 28 |
| 3 | T.Bridgewater | -1.48 | -45.8 | DEN | 31 |
| 4 | A.Rodgers | -1.54 | -53.85 | GB | 35 |
| 5 | K.Murray | -1.63 | -53.7 | ARI | 33 |
| 6 | P.Mahomes | -1.65 | -60.89 | KC | 37 |
| 7 | J.Herbert | -1.71 | -53.15 | LAC | 31 |
| 8 | D.Prescott | -1.72 | -60.35 | DAL | 35 |
| 9 | S.Darnold | -1.73 | -60.61 | CAR | 35 |
| 10 | J.Garoppolo | -1.74 | -57.34 | SF | 33 |
| 11 | J.Burrow | -1.76 | -123.03 | CIN | 70 |
| 12 | T.Heinicke | -1.76 | -66.95 | WAS | 38 |
| 13 | D.Mills | -1.78 | -55.08 | HOU | 31 |
| 14 | J.Hurts | -1.79 | -50.22 | PHI | 28 |
| 15 | R.Tannehill | -1.8 | -86.59 | TEN | 48 |
| 16 | M.Ryan | -1.81 | -72.57 | ATL | 40 |
| 17 | Z.Wilson | -1.81 | -79.66 | NYJ | 44 |
| 18 | R.Wilson | -1.84 | -60.56 | SEA | 33 |
| 19 | T.Brady | -1.87 | -54.19 | TB | 29 |
| 20 | B.Mayfield | -1.88 | -80.72 | CLE | 43 |
| 21 | T.Tagovailoa | -1.88 | -37.67 | MIA | 20 |
| 22 | M.Stafford | -1.91 | -70.65 | LA | 37 |
| 23 | D.Carr | -1.93 | -83.07 | LV | 43 |
| 24 | B.Roethlisberger | -1.94 | -77.42 | PIT | 40 |
| 25 | M.Jones | -1.99 | -61.73 | NE | 31 |
| 26 | T.Lawrence | -2.05 | -65.5 | JAX | 32 |
| 27 | D.Jones | -2.07 | -45.57 | NYG | 22 |
| 28 | K.Cousins | -2.08 | -58.14 | MIN | 28 |
| 29 | J.Fields | -2.1 | -75.77 | CHI | 36 |
| 30 | J.Goff | -2.18 | -76.18 | DET | 35 |
| 31 | C.Wentz | -2.4 | -76.91 | IND | 32 |
5. QB Data
6. Situational Regressions
| EPA | ||||
| Play Type and Down | First Down | Fourth Down | QB Scramble | |
| (1) | (2) | (3) | (4) | |
| 2nd Down | 0.020 | |||
| (0.016) | ||||
| 3rd Down | 0.003 | |||
| (0.019) | ||||
| 4th Down | 0.119*** | |||
| (0.043) | ||||
| Rush Attempt | -0.004 | -0.113*** | 0.147 | |
| (0.030) | (0.016) | (0.233) | ||
| Pass Attempt | 0.035 | -0.514** | ||
| (0.029) | (0.208) | |||
| QB Scramble | 0.415*** | |||
| (0.042) | ||||
| Constant | -0.024 | 0.045*** | 0.323* | -0.006 |
| (0.029) | (0.011) | (0.171) | (0.007) | |
| Observations | 38,105 | 16,582 | 1,081 | 40,484 |
| R2 | 0.000 | 0.003 | 0.012 | 0.002 |
| Adjusted R2 | 0.000 | 0.003 | 0.010 | 0.002 |
| Residual Std. Error | 1.368 (df = 38099) | 1.022 (df = 16580) | 2.726 (df = 1078) | 1.328 (df = 40482) |
| F Statistic | 3.250*** (df = 5; 38099) | 50.659*** (df = 1; 16580) | 6.581*** (df = 2; 1078) | 96.921*** (df = 1; 40482) |
| Notes: | ***Significant at the 1 percent level. | |||
| **Significant at the 5 percent level. | ||||
| *Significant at the 10 percent level. | ||||
This is the second straight year that QB Scramble has over a 0.4 EPA coefficient. It is something I always thought about as QBs tend to not make mistakes on scrambles and can usually gain a few yards with their legs at the least. Many young QBs play far better out of structure as they can turn their processor off and just ball.
| Yards Gained | |
| Yards | |
| Yards Gained | 8.927*** |
| (0.076) | |
| Constant | 2.048*** |
| (0.042) | |
| Observations | 40,443 |
| R2 | 0.256 |
| Adjusted R2 | 0.256 |
| Residual Std. Error | 7.061 (df = 40441) |
| F Statistic | 13,950.480*** (df = 1; 40441) |
| Notes: | ***Significant at the 1 percent level. |
| **Significant at the 5 percent level. | |
| *Significant at the 10 percent level. | |
This was purely made from a betting standpoint. Parlaying a receivers catch props with their receiving props can be profitable if
A. The book allows you.
B. They don’t take into account this colinearity.
For example, if I bet on a receiver to get 26 yards, they most likely need 2 or more catches to do so. This means if I expect them to get 26 yards, I should throw in the 2 catch prop as well.
The reason this matters is because books are betting that at least one of the bets won’t hit. In this situation, it is most likely that either 0 of 2 hit, or 2 of 2 hit.
This is very dependent on books NOT discounting for this colinearity. If they are, it needs to be analyzed at the discount rate they are using.
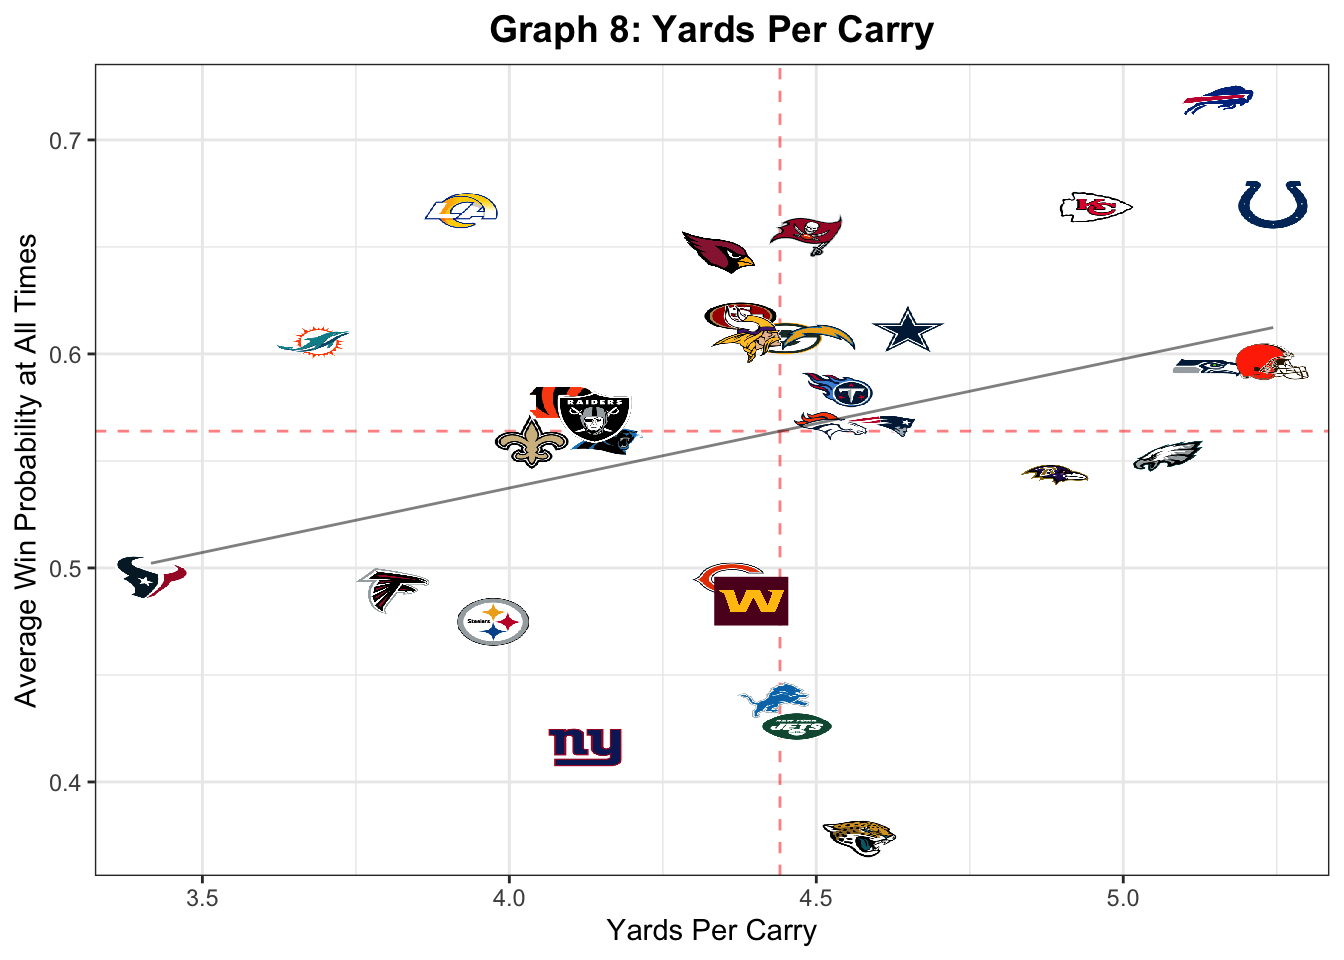
7. Rushing Data
| Run Gap | Mean EPA | Plays | |
| 1 | guard | -0.071 | 2000 |
| 2 | tackle | -0.036 | 1876 |
| 3 | end | 0.101 | 2141 |
| Run Gap | Mean EPA | Plays | |
| 1 | guard | -0.043 | 2069 |
| 2 | tackle | -0.017 | 1989 |
| 3 | end | 0.104 | 2176 |
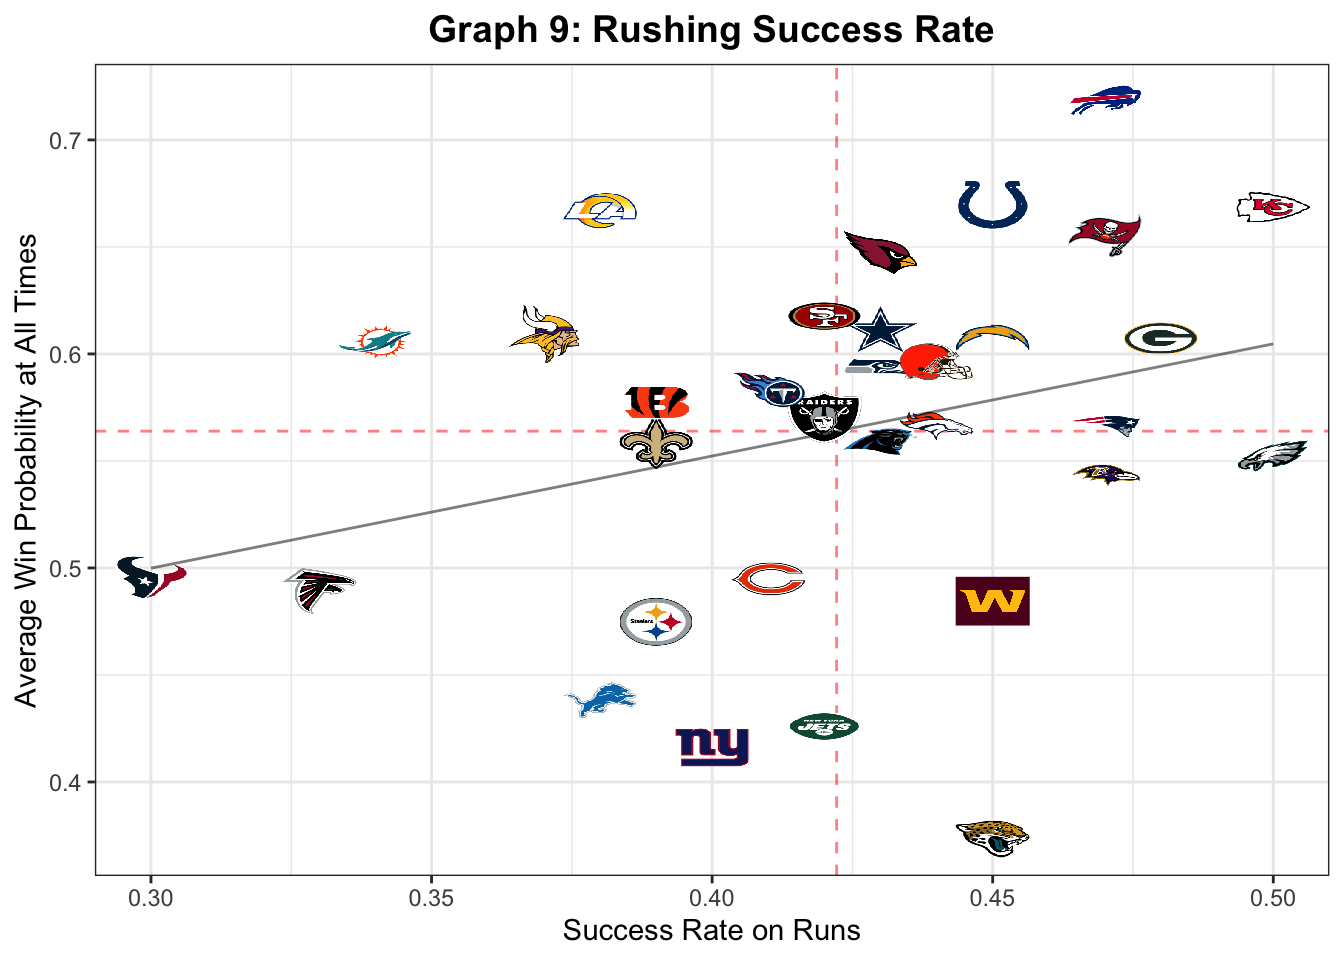
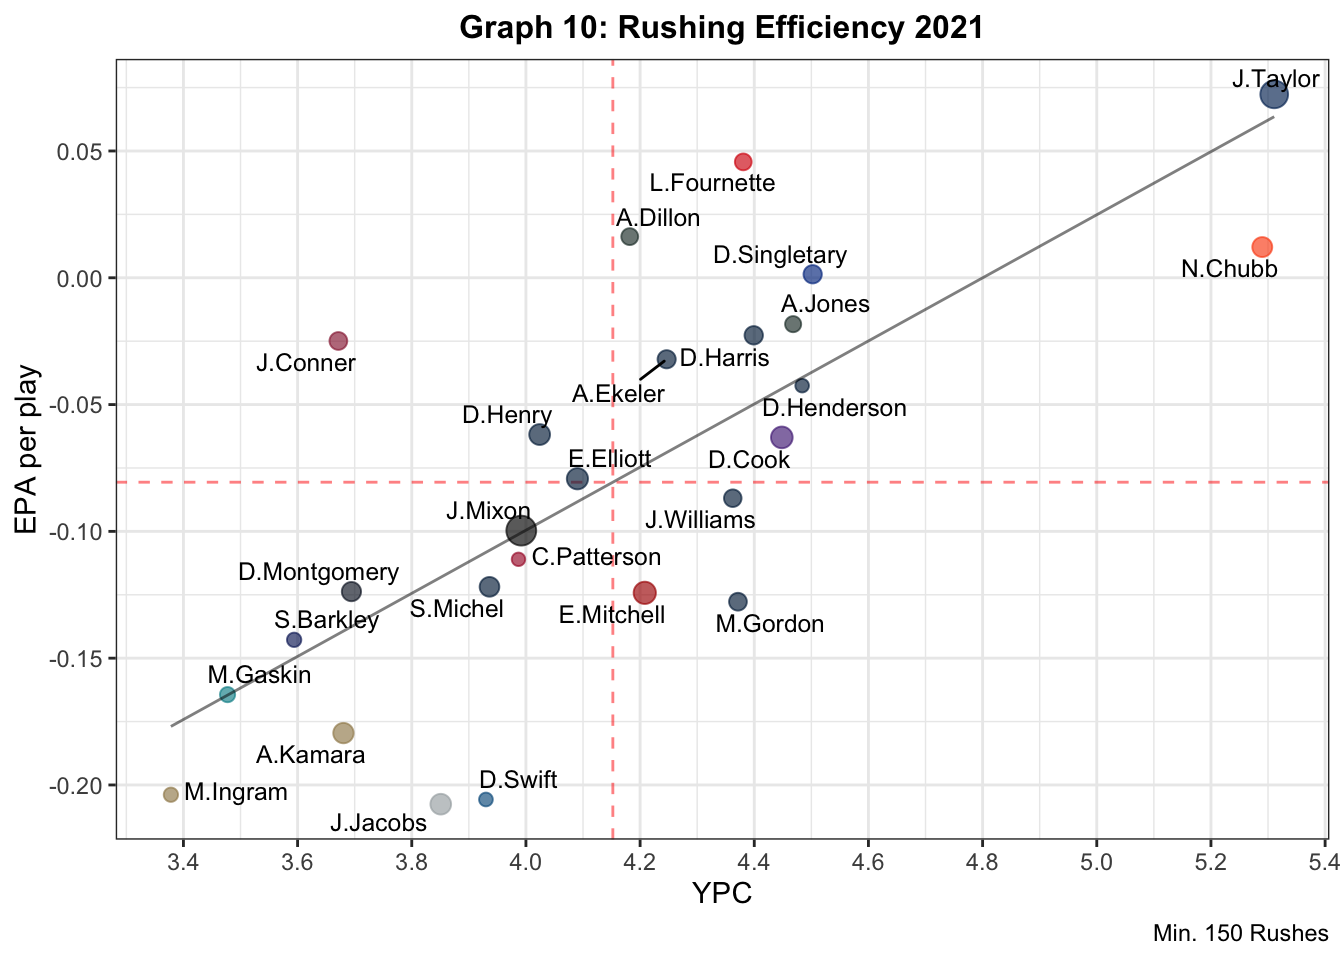
8. Rushing Efficiency
9. Pure Passing EPA Table
| Passer | Team | Mean EPA | Success Rate | Passes | |
| 1 | P.Mahomes | KC | 0.23 | 0.54 | 933 |
| 2 | M.Stafford | LA | 0.22 | 0.52 | 830 |
| 3 | J.Allen | BUF | 0.21 | 0.52 | 833 |
| 4 | T.Brady | TB | 0.17 | 0.51 | 879 |
| 5 | J.Herbert | LAC | 0.17 | 0.51 | 791 |
| 6 | J.Garoppolo | SF | 0.14 | 0.48 | 579 |
| 7 | J.Burrow | CIN | 0.14 | 0.49 | 793 |
| 8 | T.Bridgewater | DEN | 0.13 | 0.48 | 494 |
| 9 | D.Prescott | DAL | 0.13 | 0.49 | 753 |
| 10 | K.Cousins | MIN | 0.12 | 0.46 | 635 |
| 11 | K.Murray | ARI | 0.1 | 0.49 | 612 |
| 12 | M.Jones | NE | 0.1 | 0.5 | 640 |
| 13 | D.Carr | LV | 0.09 | 0.47 | 781 |
| 14 | R.Tannehill | TEN | 0.08 | 0.5 | 657 |
| 15 | T.Tagovailoa | MIA | 0.07 | 0.49 | 457 |
| 16 | R.Wilson | SEA | 0.06 | 0.45 | 482 |
| 17 | C.Wentz | IND | 0.06 | 0.46 | 620 |
| 18 | J.Hurts | PHI | 0.06 | 0.44 | 587 |
| 19 | L.Jackson | BAL | 0.05 | 0.49 | 493 |
| 20 | B.Mayfield | CLE | 0.02 | 0.44 | 514 |
| 21 | M.Ryan | ATL | 0 | 0.47 | 652 |
| 22 | D.Jones | NYG | 0 | 0.44 | 436 |
| 23 | T.Heinicke | WAS | -0.02 | 0.46 | 610 |
| 24 | B.Roethlisberger | PIT | -0.03 | 0.42 | 738 |
| 25 | J.Goff | DET | -0.03 | 0.46 | 568 |
| 26 | T.Lawrence | JAX | -0.07 | 0.45 | 704 |
| 27 | D.Mills | HOU | -0.1 | 0.43 | 466 |
| 28 | J.Fields | CHI | -0.1 | 0.43 | 374 |
| 29 | S.Darnold | CAR | -0.13 | 0.43 | 487 |
| 30 | Z.Wilson | NYJ | -0.15 | 0.38 | 467 |
10. Trick Play Passing Data
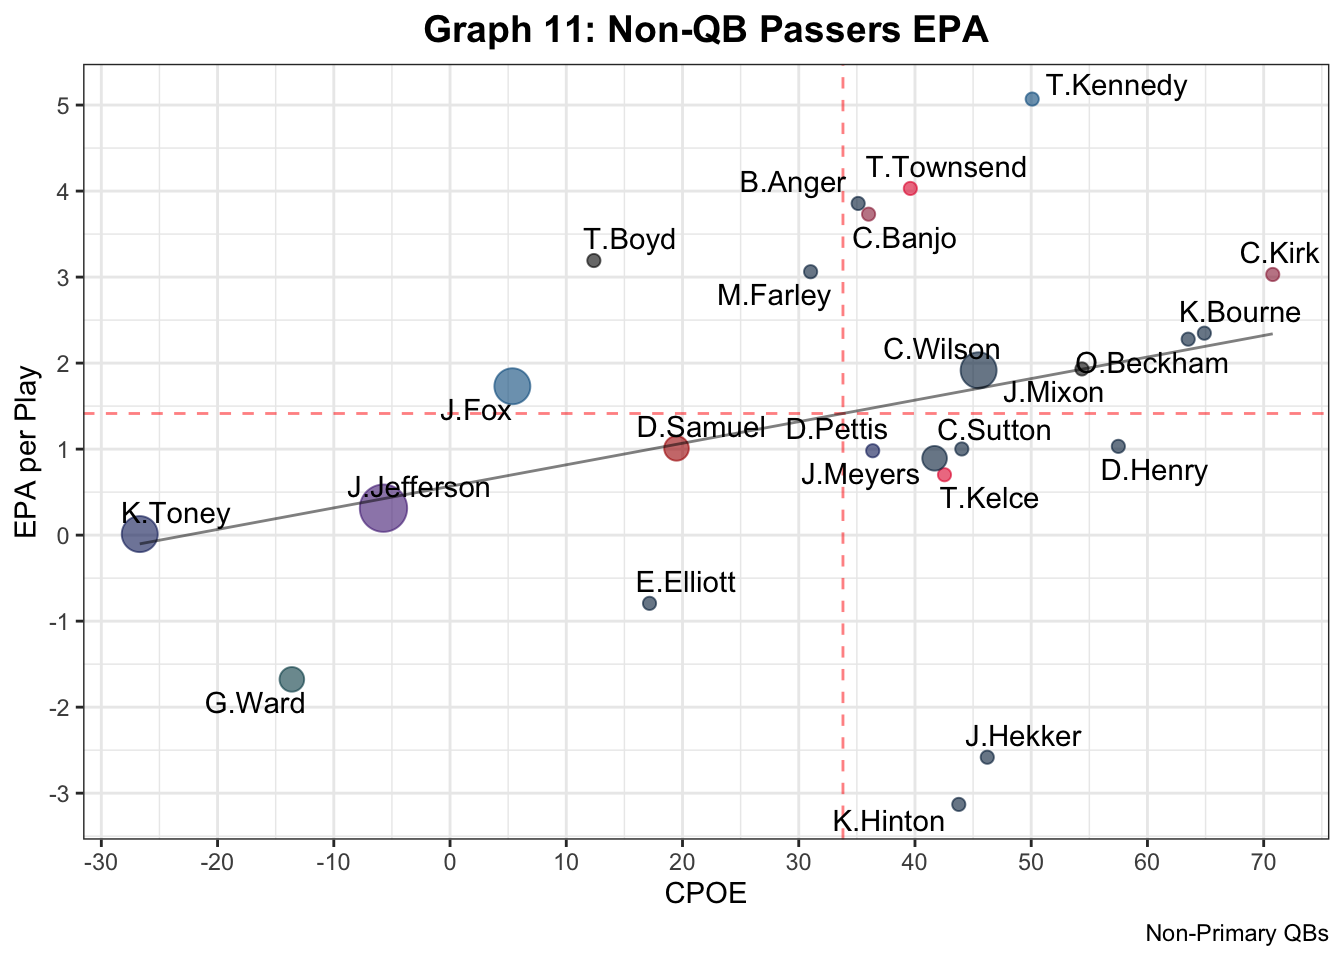
Just for fun!